Waste Disposal Pricing Higher as Economy Recovers
Date: July 26, 2021
Source: News Room
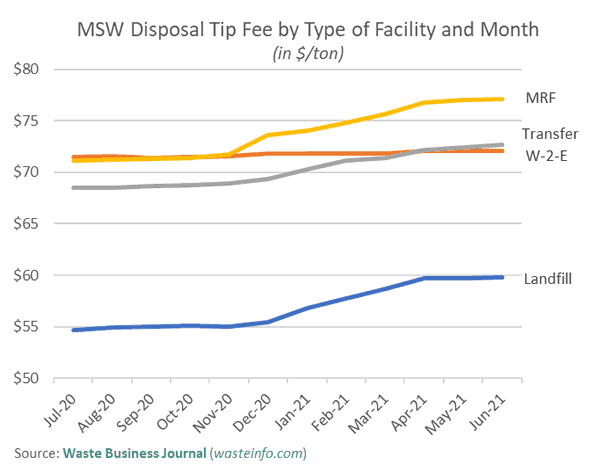
Waste disposal pricing continues its strong ride especially as the economy recovers and prices catch up after stalling somewhat during the pandemic. The average price to landfill a ton of MSW is closing in on $60. That is up 9.4 percent from a year ago and up nearly 8 percent since December 2020. Remarkably, average tipping fees rose almost 3% in 2020 to $54 per ton from $52.37 in 2019, despite COVID and the decline in 2020 tonnages.
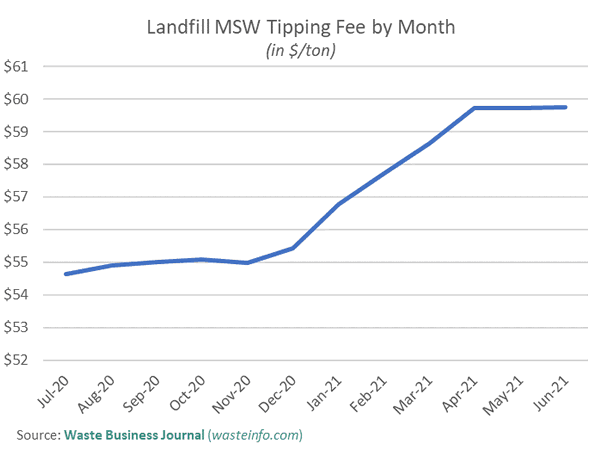
Over the longer-term, landfill pricing, which had been growing at a steady clip of around 3.5 percent, stalled as companies and municipalities struggled to hang on to business from cash-strapped customers. Today's prices are reflective of the recovering economy, inflationary pressures, decreasing landfill capacity and pricing discipline exercised by the large waste companies.
Many of the larger companies remember twenty years ago when pricing was sacrificed to win market share from competitors only to learn that it often took years to recover those prices from (appropriately) stingy municipal customers. Today's firms are ever more mindful of properly valuing their increasingly scarce landfill capacity while NIMBYism makes permitting new landfills or even expanding existing ones ever more difficult.
MSW Volume Continues its Steady Climb
The focus on capacity and inflationary pressures may help explain why pricing growth is outpacing volume growth which is up around 3 percent from a year ago. However, volumes are up nearly 10 percent from their pandemic lows in March and April of last year. This is in almost perfect tandem with US monthly Gross Domestic Product (GDP), a popular indicator of the nation's economic health. Much of the increase can be attributed to rebounding commercial volumes which many companies report now are between 85 and 95 percent of their pre-covid levels. This is even an improvement from March when these same companies reported that 70 to 75 percent of their commercial business had recovered.
Variation by Region
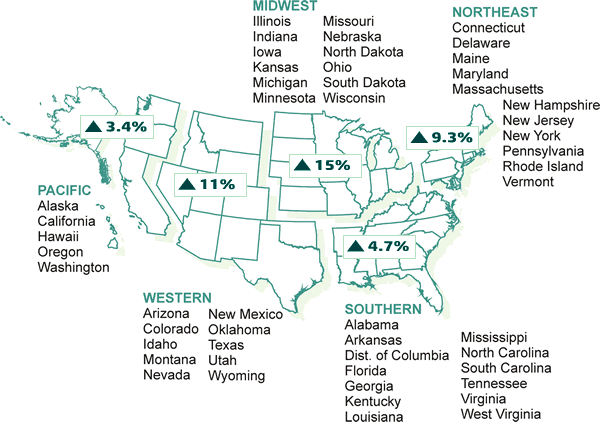
Prices around the country are all higher on the rebound in economic activity but especially in the Midwest where they are 15 percent higher than a year ago. These states, which include Pennsylvania and Ohio, receive significant volumes from the northeast, especially New York and New Jersey. Only the Pacific states had more modest pricing growth of 4.5 percent year-over-year. That is likely due to the greater share of landfill volume controlled by municipalities which is just over 50 percent. That contrasts with roughly 36 percent municipal-control of landfill volumes nationwide.

Table: Top 10 Most Expensive States to Landfill MSW
| Rank | State | Average Tipfee |
| 1 | Massachusetts | $122.63 |
| 2 | Minnesota | $119.69 |
| 3 | Vermont | $116.46 |
| 4 | Rhode Island | $114.96 |
| 5 | Missouri | $100.20 |
| 6 | Washington | $100.08 |
| 7 | Connecticut | $92.61 |
| 8 | New Hampshire | $89.76 |
| 9 | Pennsylvania | $89.01 |
| 10 | Hawaii | $87.55 |
Table: Top 10 Least Expensive States to Landfill MSW
| Rank | State | Average Tipfee |
| 1 | Idaho | $27.83 |
| 2 | Utah | $31.49 |
| 3 | New Mexico | $38.71 |
| 4 | Mississippi | $38.93 |
| 5 | Montana | $39.03 |
| 6 | Louisiana | $39.28 |
| 7 | Arizona | $39.57 |
| 8 | Nebraska | $40.13 |
| 9 | Alabama | $40.82 |
| 10 | Oklahoma | $40.93 |

Year-over-Year Price Increases by Region
Variation by Type of Ownership
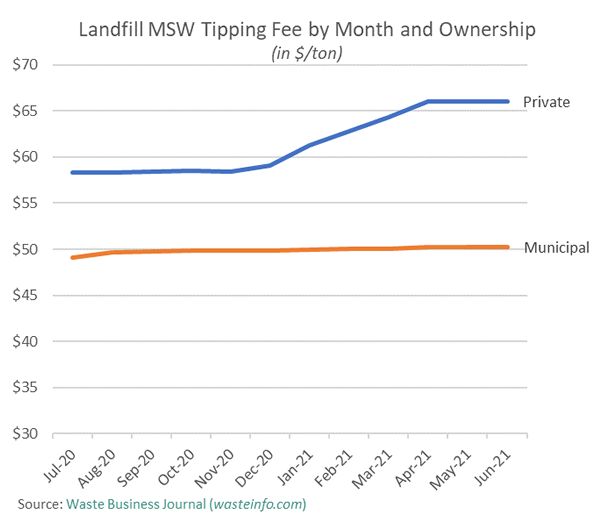
For municipalities, raising prices at locally owned landfills is often a political decision rather than a purely business one. Moreover, the need to raise prices is often mitigated by fees or local taxes that subsidize the waste management infrastructure. This is reflected in the data. Year over year tipping fees charged by privately owned or controlled landfills grew by 13 percent as of June compared to a 2.4 percent increase in prices charged by municipally owned and operated landfills.
The Top Four Companies
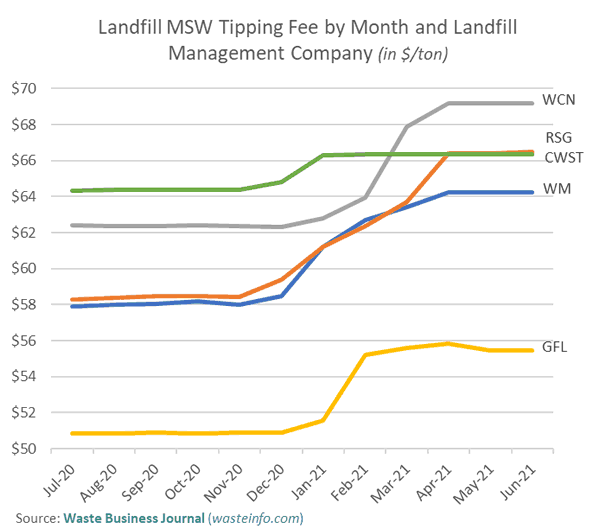
Not surprisingly, landfill prices charged by the top four companies have risen in line with that of all private entities, especially since they collectively control over 64 percent of landfill MSW volume. Many of the larger companies are expected to get an additional boost from inflation as most now have between 30 and 50 percent of their waste contracts tied to some type of index analogous to the consumer price index (CPI).
Variation by Type of Facility
As landfills are the ultimate destination of 66 percent of generated MSW and 90 percent of disposed MSW, we often use them as a bellwether for the industry. The same applies to MSW which accounts for 68 percent of wastes passing through the municipal waste infrastructure. MSW prices vary depending upon the type of facility through which it is being processed. The highest prices are charged at transfer stations where the average price was $72.70 per ton as of June. This is expected as transfer stations account for not only the landfill or waste-to-energy disposal cost, but also processing and transportation costs.
Waste-to-energy facilities also charge relatively high tipping fees. Those averaged $72.04 per ton as of June. Their pricing is a function of operating cost and proximity more densely populated markets. Many of these plants are in the Northeast and Florida where landfills are more scarce and high population density creates high waste disposal demand. However, waste-to-energy plants must also factor in their very high capital and operating costs even net of energy sales. Facility owner operators lock in these higher prices through longer term disposal contracts with their host municipalities and therefore waste-to-energy tipping fees tend to fluctuate much less over time than is the case with landfills and transfer stations or other processing facilities.
More detailed statistics are available in Waste Business Journal's latest Monthly Pricing and Volume Index that includes data through June 2021.
Waste Business Journal conducts research and publishes reports on the waste management industry. Our mission is to provide industry stakeholders with the vital information they need to guide their wise decisions.
Our researchers survey individual waste processing and disposal facilities, waste management companies and government entities. We gather information about the types and volumes of the many types of waste being managed, the prices paid, what kinds of equipment are employed, who owns the facility, who operates it, the market area served, remaining and operating capacity, among many other questions. We compare the data we collect with those collected from other sources such as the various state regulatory agencies, the US EPA, and others to cross check and augment the information.
Sign up to receive our free Weekly News Bulletin