Some Observations about EPA Recycling Data and Objectives
Date: November 18, 2020
Source: News Room
EPA Says Recycling Rate Declined in 2018

Recently released numbers by the EPA on recycling reflect what Waste Business Journal has been saying for years: that recycling has stagnated and even declined in recent years.
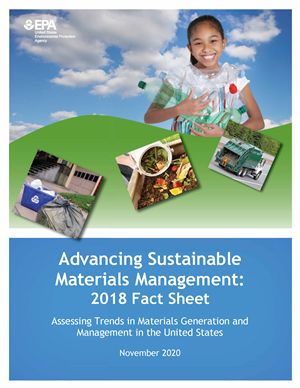
In their new report, EPA data shows the combined recycling and composting rate increased from less than 10 percent of generated MSW in 1980 to 35 percent in 2017 but then dipped to 32 percent in 2018.
EPA says part of the decline is due to increases in waste generation that has outpaced modest recycling progress. "Although more tons were recycled in 2018 than ever before, the recycling rate decreased to the lowest levels since 2006," EPA reported.
More Focus on Food Waste
However, some of the decline the agency attributes to a change in measurement. To more fully account for food waste in the system, the agency included a new category of alternative food waste management pathways that added 17.7 million tons that was previously ignored. This brings food waste as a category to a total of 22 million tons making up 6.1 percent of overall generation.
Expanding beyond composting, combustion with energy recovery and landfilling, 2018 estimates include food flowing to a total of nine pathways. Those pathways include animal feed, land application, codigestion/anaerobic digestion, bio-based materials/biochemical processing, donation, sewer/wastewater treatment. Per the EPA's waste recovery hierarchy, these are all generally viewed as more preferable outcomes than disposal but are not counted toward the national recycling rate.
According to the EPA, the overall rate was also affected by a decrease in composting, which dropped from 27 million tons in 2017 to 24.9 million tons in 2018. Without including composting, the recycling rate was 23.6 percent, down from 24.9 percent.
Many Reasons Why Advances Recycling are Ever Harder to Achieve
In addition to waste generation outpacing the growth of recycling infrastructure, there are other reasons for stalling recycling rate improvement. The more recent recycling rate decline came amid a period of upheaval in global recycling markets. China in 2018 began tightly restricting imports of recyclables as part of its National Sword campaign, impacting pricing and recovery rates.
But there are longer term structural issues also at play. In a sense, you can say we have already picked all the low hanging fruit as most communities now have curbside recycling programs. And today those communities that manage them are often cash strapped and barely able to maintain, let alone expand existing programs. The movement to single-stream recycling programs was a double-edged sword that brought big advances in community participation but also new challenges from product contamination.
Economics is key. Relatively cheap landfill disposal results in lower economic incentives to recycle as a means of disposal cost avoidance. That is usually why the areas of the country with the lowest recycling rates are where landfill capacity is plentiful and tipping fees are lower. Relatively low energy prices in recent years, thanks in part to fracking, means cheaper virgin materials that compete with recycled commodities. Cheap oil means cheaper plastic. And today, the products made from those materials require less of it. An aluminum can, for example, that on average weighed 21 grams in 1972 only weighs about 14 grams today. There is a similar story for other beverage containers.
EPA Sets Ambitious Goal
Three years ago the EPA convened the first-ever America Recycles Summit, which brought together industry, government and nonprofit leaders to find solutions to advance the nation's recycling infrastructure, create new markets for recycled materials and improve public education regarding recycling.
Speaking at the agency's third annual America Recycles Summit this week, Administrator Andrew Wheeler announced a goal to achieve a 50 percent national recycling rate by 2030. As elaborated by Peter Wright, assistant administrator of EPA's Office of Land and Emergency Management, the goal will be supported by three objectives: reducing inbound contamination, improving processing efficiency and strengthening end markets. "As it's been said, people want to recycle, but they continue to be confused about what to put in the bin, and it depends on where they live," Wright said.
"Unfortunately, new products are not always designed to be well matched to the ability of existing infrastructure to recycle them … we need to address how products are designed to be easily recycled at MRFs,"
"The environmental and economic benefits from recycling are clear, and we've made a lot of progress, but much more needs to be done to get our national recycling rate where it needs to be," EPA Administrator Wheeler says. "Our America Recycles Network partnerships will usher in dramatic changes in U.S. recycling by improving aging infrastructure, developing secondary markets, and communicating recycling methods more effectively with the public."
EPA also released a new 2020 edition of its Recycling Economic Information report. Based on 2012 data, it estimates recycling and reuse activities generate 681,000 jobs or 1.17 jobs created for every 1,000 tons of material recycled, $37.8 million worth of wages and $5.5 billion in tax revenues per year.
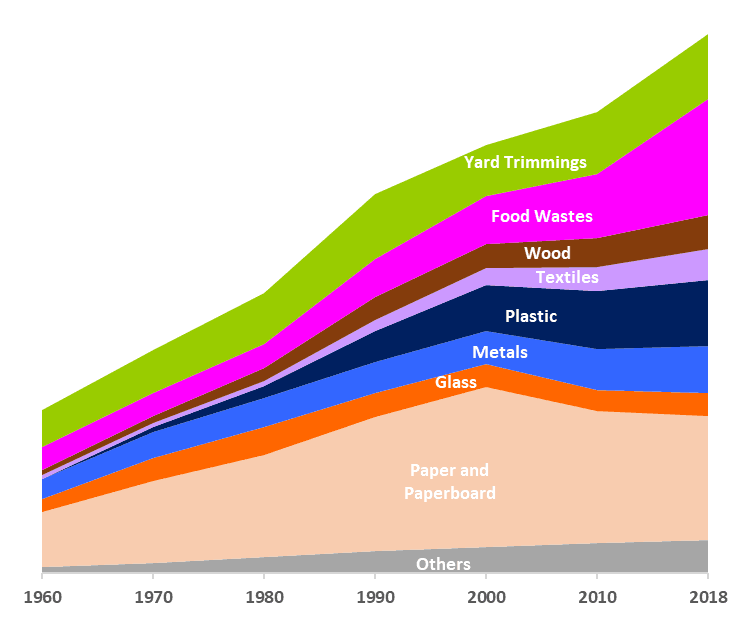
Composition of Materials in the Waste Stream by Year
(in 000's of Tons)
| Material | 1960 | 1970 | 1980 | 1990 | 2000 | 2010 | 2018 |
| Paper and Paperboard | 29,990 | 44,310 | 55,160 | 72,730 | 86,780 | 71,310 | 67,390 |
| Glass | 6,720 | 12,740 | 15,130 | 13,100 | 12,610 | 11,530 | 12,250 |
| Metal | 10,820 | 13,830 | 15,510 | 16,550 | 18,020 | 22,410 | 25,600 |
| Plastic | 390 | 2,900 | 6,830 | 17,130 | 24,710 | 31,040 | 35,680 |
| Textiles | 1,760 | 2,040 | 2,530 | 5,810 | 9,380 | 13,120 | 17,030 |
| Wood | 3,030 | 3,720 | 7,010 | 12,210 | 12,940 | 15,880 | 18,090 |
| Food Wastes | 12,200 | 12,800 | 13,000 | 20,800 | 25,900 | 34,760 | 63,130 |
| Yard Trimmings | 20,000 | 23,200 | 27,500 | 35,000 | 27,730 | 33,400 | 35,400 |
| Others | 3,210 | 5,520 | 8,970 | 11,880 | 13,890 | 16,410 | 17,790 |
| Total MSW | 88,120 | 121,060 | 151,640 | 205,210 | 231,960 | 249,860 | 292,360 |
Source: U.S. EPA
Composition of Materials in the Waste Stream by Year
(in 000's of Tons)

Source: U.S. EPA
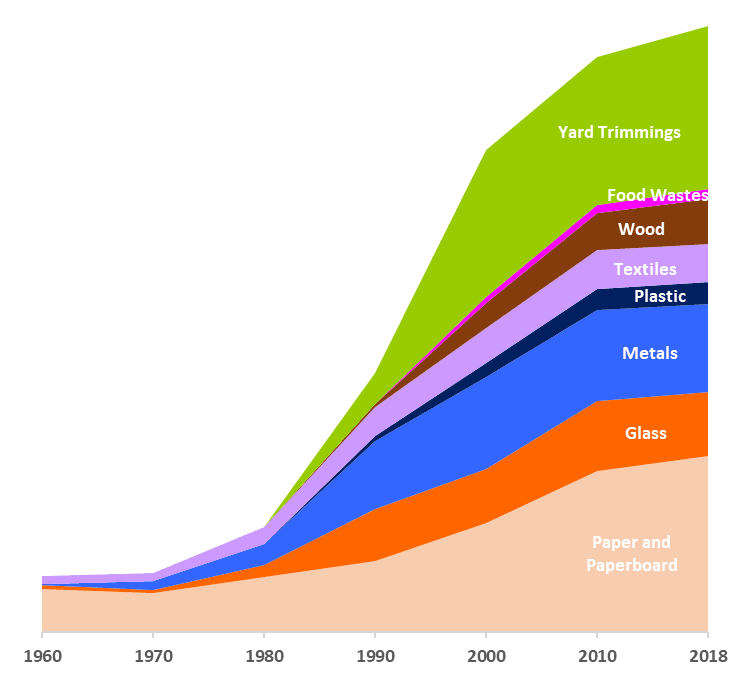
Percentage Recovery by Material and by Year, 1960 to 2018
(as % of Waste Generated)
| Material | 1960 | 1970 | 1980 | 1990 | 2000 | 2010 | 2018 |
| Paper and Paperboard | 16.9% | 15.3% | 21.3% | 27.8% | 42.3% | 62.5% | 68.2% |
| Glass | 1.5% | 1.3% | 5.0% | 20.0% | 21.1% | 27.1% | 25.0% |
| Metal | 0.5% | 3.5% | 7.9% | 26.1% | 35.4% | 35.1% | 34.1% |
| Plastic | 0.0% | 0.0% | 0.3% | 2.2% | 5.4% | 8.2% | 8.5% |
| Textiles | 2.8% | 2.9% | 6.3% | 11.4% | 13.5% | 15.0% | 14.7% |
| Wood | 0.0% | 0.0% | 0.0% | 1.1% | 9.6% | 14.5% | 17.1% |
| Food Wastes | 0.0% | 0.0% | 0.0% | 0.0% | 2.6% | 2.8% | 4.1% |
| Yard Trimmings | 0.0% | 0.0% | 0.0% | 12.0% | 56.9% | 57.5% | 63.0% |
| Total Recycling | 6.4% | 6.6% | 9.6% | 16.4% | 29.2% | 34.1% | 32.1% |
Source: U.S. EPA
Percentage Recovery by Material and by Year, 1960 to 2018
(as % of Waste Generated)

Source: U.S. EPA
By material, the paper recycling rate increased notably, as did aluminum recovery. Plastics and glass recycling, however, stayed flat. The EPA reported that 6.04 billion pounds of U.S. plastic was recycled in 2018, only 8.5 percent of the 71.36 billion pounds generated.
The Good News
Recovery of wastepaper has been a bright spot of late. The result of stay-at-home workers has created a big spike in demand for and increased recycling of OCC and other paper products. Some mills are switching to mixed paper processing from recycling discarded office paper that has now become scarce. Consequently, prices for mixed paper have risen from zero at the beginning of the year to about $30 a ton this month on higher demand from domestic mills.
OCC now makes up a third of the paper entering recycling plants from homes in big metropolitan areas, up from just 5 percent a few years ago. The overall collection volume from U.S. residential recycling programs is up at least 7 percent from a year ago. Industry leader Waste Management has opened two new MRFs in Chicago and Salt Lake City with plans for a third plant in Raleigh later this year.
And while China will stop accepting any U.S. scrap exports next month, China lacks the recycling infrastructure to meet its own paper and cardboard demand. As a result, mills in Vietnam, Malaysia and elsewhere are increasing production of pulp and cardboard made from U.S. recycled paper and exporting them to China.
Where to go from Here
Again, economic incentives are essential to driving improvement in recycling. As EPA's Peter Wright elaborated in his agency's National Recycling Strategy, new products should be designed to be easily recycled. But we need to go beyond that. Driving demand for recycled commodities will require products with recycled content requirements or various degrees of producer responsibility for end-of-life products.
Much of this will require a common language. As Wright has noted, standardized definitions, measures, targets and performance indicators are essential to progress. As management guru Peter Drucker once said, "you can't manage what you don't measure." We cannot know what works in recycling or how it works or how it compares to other approaches without a common language comprised of standardized definitions.
We will continue to require government and private sector investment at all levels of the value chain to increase incentives and drive down cost. New technologies, already revolutionizing everything from company operations, fleet management, the operation of MRFs, etc. will continue to increase efficiencies and thereby reduce costs. Every aspect of the waste management infrastructure should be examined. Not the least of which should be landfills. Many environmentalists argue that landfills do not fully capture their environmental impacts as reflected in their pricing. Making them more expensive creates a greater economic incentive through landfill cost avoidance to recycle waste materials instead.
Sign up to receive our free Weekly News Bulletin