Time is Running Out: The U.S. Landfill Capacity Crisis
Date: May 14, 2018
Source: Waste Business Journal
Time is Running Out: The U.S. Landfill Capacity Crisis
By James Thompson, Waste Business Journal, SWEEP Steering Committee & Rob Watson, Chief Science Officer, Eco-Hub LLC. Founder & Co-chair SWEEP Standard.

A pair of interrelated storm clouds looms over the waste industry, providing perhaps a gray lining to the rosy 2018 Q1 earnings reports released by most of the major waste companies.
The first, the growing crisis in the US recycling industry precipitated by the closure of China’s market to materials recovered from other parts of the world, has been reported extensively.
What is not receiving as much attention is the looming shortage of landfill capacity in the United States.
Based on data collected by Waste Business Journal, over the next five years, total landfill capacity in the U.S. is forecast to decrease by more than 15%. This means that by 2021 only 15 years of landfill capacity will remain. However, in some regions it could be only half that.
Yet, even this grave forecast may be optimistic. Because of China’s new rules, the bottom has dropped out of the recycling market and is expected to remain in the doldrums for several years while new infrastructure is developed. As a result, material recovered in curbside recycling programs increasingly is being diverted to landfills or incinerators. Landfilling even half of the recovered materials would result in just over 10 years of remaining landfill capacity by 2021.
Although we are certain that some capacity additions are on the horizon that we may not have included, given that new landfill capacity can take years to permit and bring on line, we expect that this capacity crunch will increase upward pressure on disposal costs. This will be the subject of a future article.
Table 1 below shows that, in spite of modest air space additions in 2016, an annual capacity shortfall (volume landfilled exceeds capacity expansion) developed in 2017. This annual net airspace loss is expected to more than double by 2021, with a net capacity loss of over 1 billion tons during that timeframe.
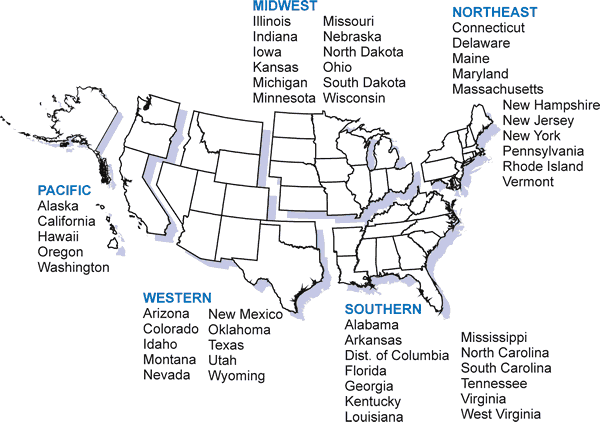
Regionally, the Northeast is most heavily affected, losing approximately 30% of its capacity over the next five years, followed by the Midwest with a 24% capacity loss. Not surprisingly, the Northeast and Midwest regions also have the shortest remaining landfill life. The Western region fared the best with regards to reductions in net landfill capacity (8% by 2021) and, at 22 years, has the longest remaining capacity.
Table 1: Net Capacity Changes 2016-2021 (‘000 tons)
| Region | 2016 | 2017 | 2018 | 2019 | 2020 | 2021 | Vs. 2015 | % loss |
| Northeast | 9,222 | -23,737 | -34,192 | -39,225 | -41,429 | -41,858 | -171,220 | -30.3% |
| Southeast | -16,922 | -43,239 | -44,375 | -56,047 | -70,617 | -77,923 | -309,123 | -15.3% |
| Midwest | 16,570 | -46,265 | -64,787 | -65,372 | -69,889 | -79,839 | -309,583 | -24.1% |
| Western | 14,630 | -13,294 | -24,114 | -35,905 | -57,813 | -59,643 | -176,138 | -8.8% |
| Pacific | 81,794 | -24,230 | -39,117 | -41,431 | -48,448 | -49,320 | -120,753 | -11.1% |
| Entire US | 105,293 | -150,765 | -206,584 | -237,980 | -288,196 | -308,584 | -1,086,817 | -15.6% |
Table 2 shows that, across the United States at current rates of net landfill capacity changes, by 2021 there will be approximately 15 years of landfill capacity remaining, representing an annual rate of loss of 2.6%. The Northeast region has the greatest annual rate of capacity loss at 5% with the expected remaining capacity in years by 2021 dwindling down to eight. The next most capacity constrained region, the Midwest, is expected to only have about 11 years of capacity by 2021 at expected rates of net capacity loss. Out west, there is less pressure on landfill capacity with annual rates of loss less than half that of the more capacity constrained regions and more than double the expected remaining lifetime in currently permitted facilities.
Table 2: Remaining Landfill Capacity in 2021 and Annual Rate of Capacity Loss
| Region | Remaining Capacity (years) | Annual rate of loss |
| Northeast | 8 | -5.0% |
| Southeast | 14 | -2.5% |
| Midwest | 11 | -4.0% |
| Western | 22 | -1.5% |
| Pacific | 17 | -1.9% |
| Entire US | 15 | -2.6% |

Sign up to receive our free Weekly News Bulletin